

Tools
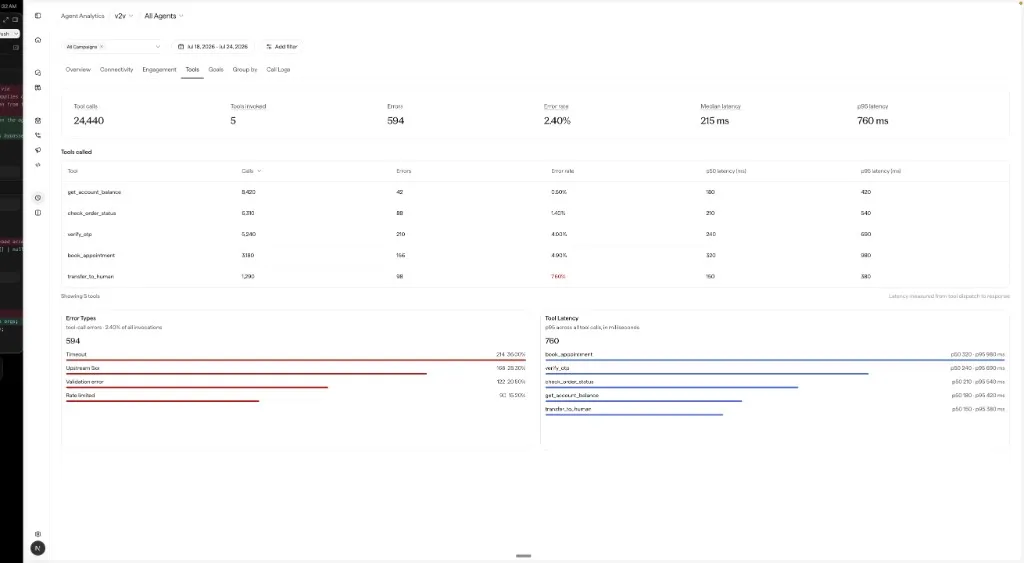
Tools is a tab under Monitor → Agent Analytics. It shows how your agent’s custom tools are performing — call volume, errors, latency, and a per-tool breakdown — so you can tell whether a tool is failing or slow before it affects live conversations.
Open Monitor → Agent Analytics and select the Tools tab.
The Tools tab is available for voice agents. It reports on the custom tools your agent calls, not built-in platform actions.
When to use Tools
- A tool’s error rate is climbing and you want to find which one.
- Tool latency is adding noticeable delay to the agent’s responses.
- You want to confirm which tools are actually being called, and how often.
KPI tiles
Each tile summarizes the selected period.
Tools called
A per-tool table, sorted by call volume by default.
Latency is measured from tool dispatch to response.
Error types
A breakdown of tool-call errors by type, ranked by frequency, with each type’s share of all tool errors. Use it to see whether failures cluster around one kind of error, for example a timeout or an exception from a single service.
Tool latency
A per-tool latency breakdown ranked by p95, showing p50 and p95 side by side. Use it to spot the tools contributing the most delay to responses.
How to investigate
Scan the KPI tiles
Check the overall error rate and p95 latency first. If both look healthy, tools are not the problem.
Find the offending tool
Sort the Tools called table by error rate or p95 latency to see which tool is responsible.
Confirm on a real call
Open Call Logs with the same filters, open a call, and use Log Analyser to inspect the tool call on the turn where it failed.