

Overview tab
The Overview tab provides a period-level health check for your voice agents. In a single screen it shows volume, connect rate, latency, and early hang-ups without opening a transcript.
Open Monitor → Agent Analytics and select the Overview tab.
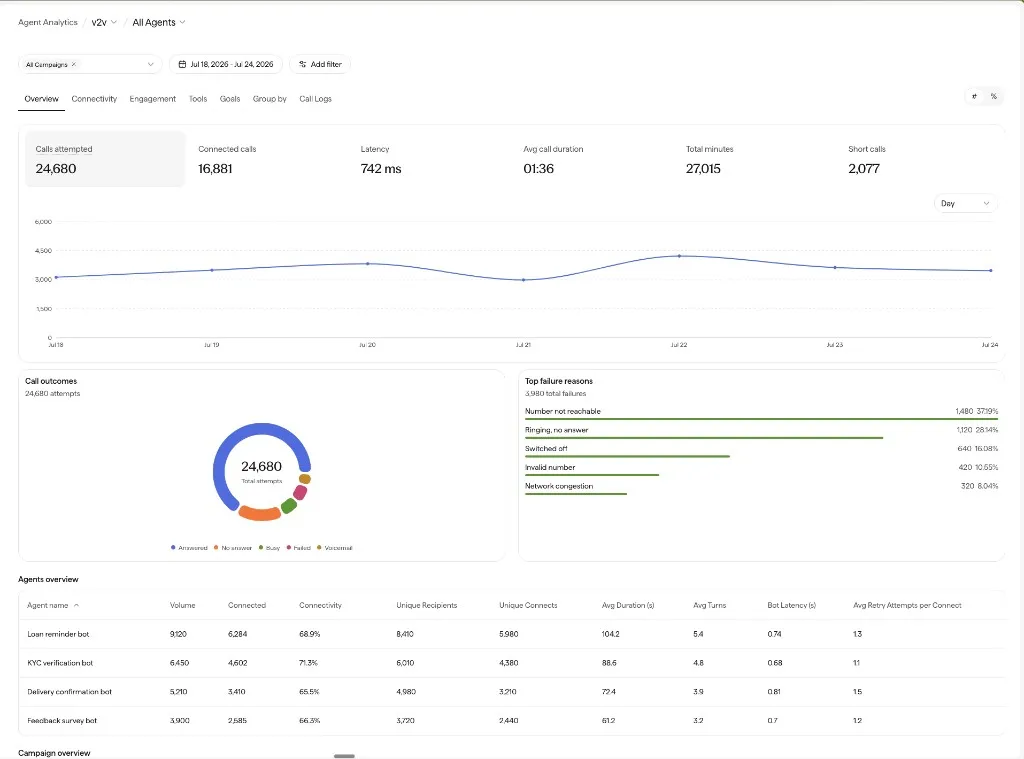
Questions Overview answers
- How many calls did we attempt, and how many connected?
- Did latency or average duration move the wrong way?
- Are too many connected calls ending after a single turn?
- Which agents or campaigns carry volume and connectivity?
KPI tiles
Click a tile to drive the trend chart below. Use the # / % toggle to switch rate tiles between count and percent.
A Goal achievement tile appears when a selected agent has a goal configured.
Charts on this tab
How to use Overview
Read the headline tiles
Start with Calls attempted, Picked-up rate, and Short calls. Large moves here usually mean a telephony, prompt, or campaign change is worth investigating.
Separate “didn't answer” from “couldn't dial”
Use Call outcomes and Top failure reasons. Not picked is different from a carrier or credits failure.
Find which entity moved
Open the Agents or Campaign tables when the aggregate number looks wrong but you don’t know who caused it.
Confirm with real calls
If a metric still looks suspicious, open Call Logs with the same filters and sample a few rows before changing the agent.