

Log Analyser
Log Analyser is the deep-dive view for a single conversation. It lives under Monitor → Agent Analytics and opens from a call in Call Logs.
Open it once you have identified a call that failed and need to understand why a specific turn went wrong. From Call Log Details, click a transcript message or a lifecycle chip.
Until you select a turn, the view shows its empty state: Select a transcript message to view log details.
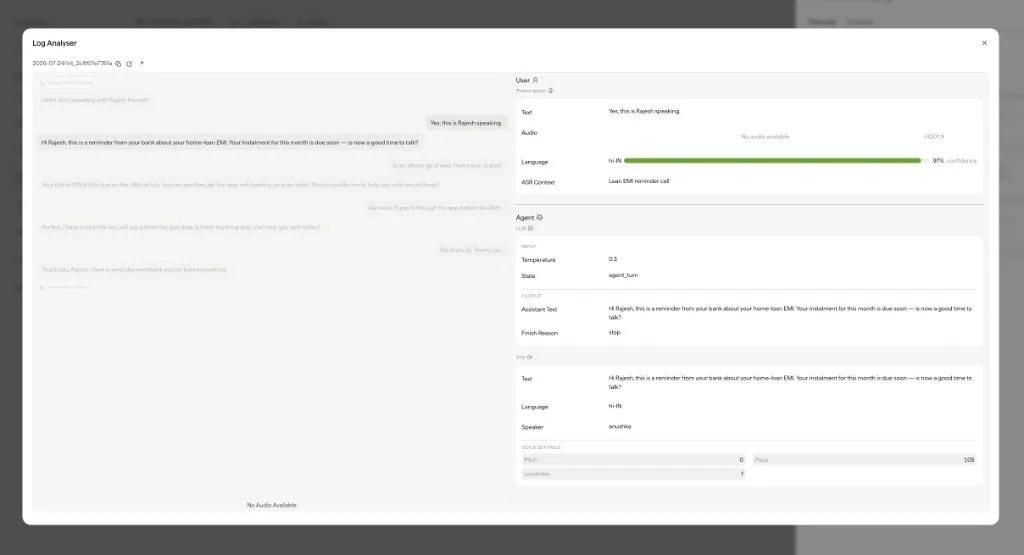
What you can inspect
- Config at start — the speaker, ASR model, and language in effect when the call began.
- ASR quality — transcript text, confidence, audio waveform, and ASR context.
- Tool activity — the exact inputs and outputs of each tool call, rather than the agent’s paraphrase of them.
- End state — final variables, disposition flags, and open questions.
Cards by moment in the call
Conversation Initiated
User turn
Agent turn
Conversation Ended
How to debug a bad turn
Start at Conversation Initiated
Confirm the speaker, ASR model, and language before attributing a problem to a later turn.
Compare transcript text with audio
On user turns, review the waveform and confidence together. Low confidence combined with incorrect text usually indicates an ASR or language-switch issue.
Call Logs finds the conversation; Log Analyser explains the turn. For aggregate patterns, start on the dashboards below, then sample a few calls here.