

Group by
Group by is a tab under Monitor → Agent Analytics. It lets you slice the same connectivity metrics by a chosen dimension: campaign, agent, language, bot number, or an agent variable. Use it when the Overview looks healthy in aggregate but you need to identify which campaign, number, or language is dragging the numbers down.
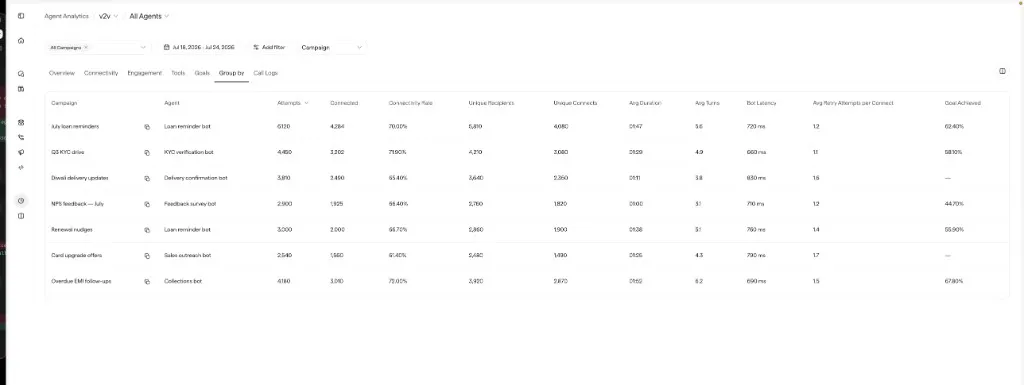
When to use Group by
Group by is most useful when:
- One campaign looks healthy in Overview but you suspect another is failing.
- You want connectivity by bot number without relying on the Connectivity tab’s phone-health table alone.
- You are comparing languages or agents side by side.
- You need a rollup by a custom agent variable, which requires a single-agent selection.
Choose a dimension
The dimension you select determines what a single row represents:
The default dimension is Campaign. Changing the dimension resets the table to page 1.
Agent variable stays disabled until a single agent is selected. If you switch back to All Agents while that dimension is active, the tab falls back to Campaign.
Columns
Every row shares the same metric columns:
The default sort is Attempts descending. Click a column header to re-sort. The table is paginated.
How to use Group by
Set the same toolbar filters as Overview
Choose agents, campaigns, and a date range first. Group by respects the shared Agent Analytics filters.
Pick a dimension
Start with Campaign or Bot number for outbound health. Use Language when engagement or connect quality differs by locale.
Sort on the metric that moved
If connectivity fell, sort by Connectivity Rate. If volume concentrated somewhere unexpected, sort by Attempts.
Confirm with Call Logs
Open Call Logs with the same filters and sample rows from the underperforming group before you change the agent or campaign.