

Call Logs
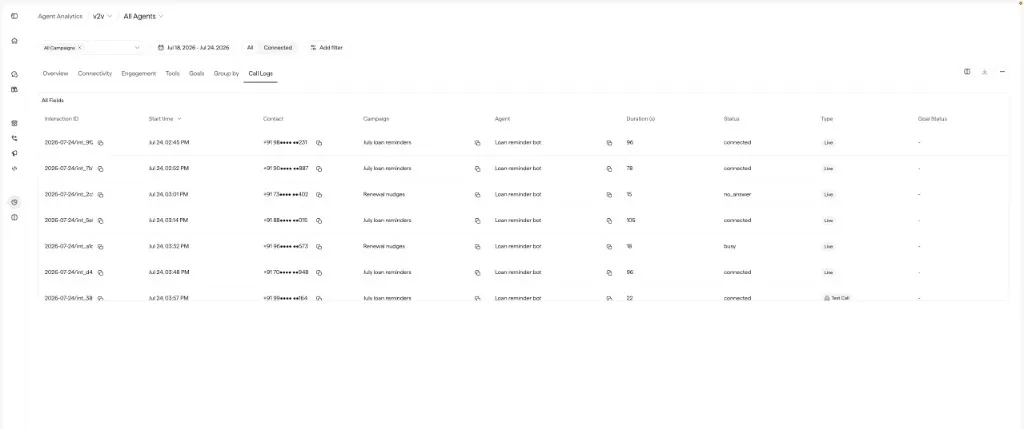
Call Logs is the row-level history of every call your agents have handled. It lives under Monitor → Agent Analytics → Call Logs.
Use it to locate the exact call behind a change in connect rate or engagement, open its transcript and metadata, and then continue to Log Analyser for turn-level detail.
What you can do
- Find a call - filter by campaign, contact, failure reason, or test agent traffic.
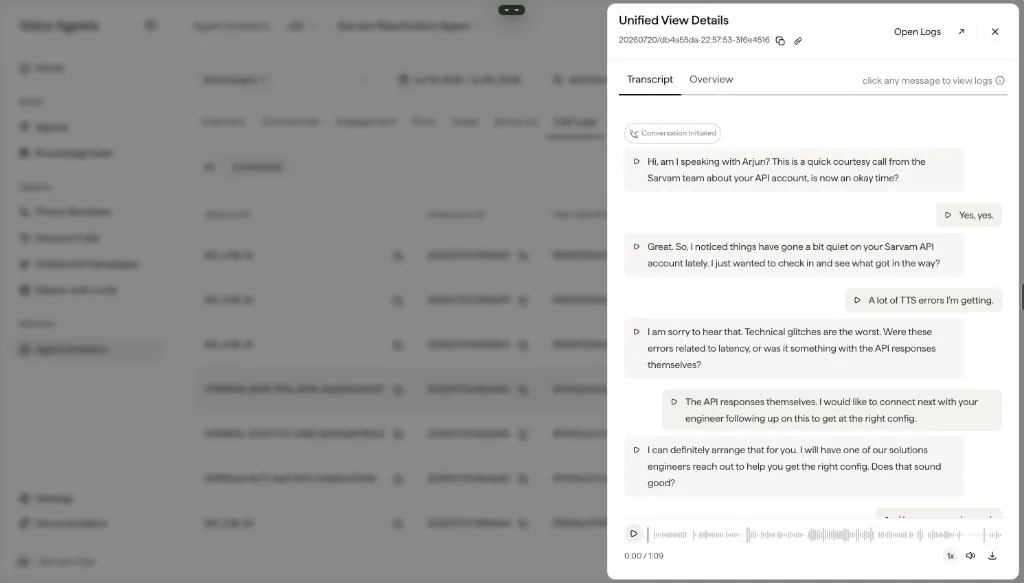
- Open its details - click a row to view the transcript and metadata.
- Debug a turn - click a message to open Log Analyser.
Filter the table
The shared toolbar filters (Agents, Campaigns, Date range, Filters) still apply. Call Logs adds a few controls of its own:
Default sort is newest first. Click any column header to re-sort. Text filters support equals / contains / starts with; number filters support comparisons.
How to review a call
Keep the same scope as your chart
If Overview showed a change for a specific agent and date, apply the same filters here so the signal carries over.
Review several examples before concluding
Open multiple rows that share a failure reason or a short duration. A single unusual call is not a reliable pattern.
Open Call Log Details
Transcript
Overview
Full conversation. Click a message, or the Conversation Initiated / Conversation Ended chips, to open Log Analyser.
Hand off to Log Analyser
Use Call Logs to find the call, then use Log Analyser to explain what happened during a turn.
For details on the recording itself, including mono vs stereo channel layout and how to enable dual-channel recordings, see Call recordings.
Column reference
Visible labels can vary by org. Expand a group when you need the dictionary.
Identity & routing
Outcome & quality
Channel & extras
You may also see start/end datetime, job ID, retry attempts, provider type, Test Call / Live badges, agent variables, and goal status when configured for your org.