

Agent Analytics
Agent Analytics is the dashboard for monitoring voice agent performance.
Use it to track whether calls are connecting, whether conversations progress, and to open any call when a metric looks wrong.
Open Monitor → Agent Analytics.
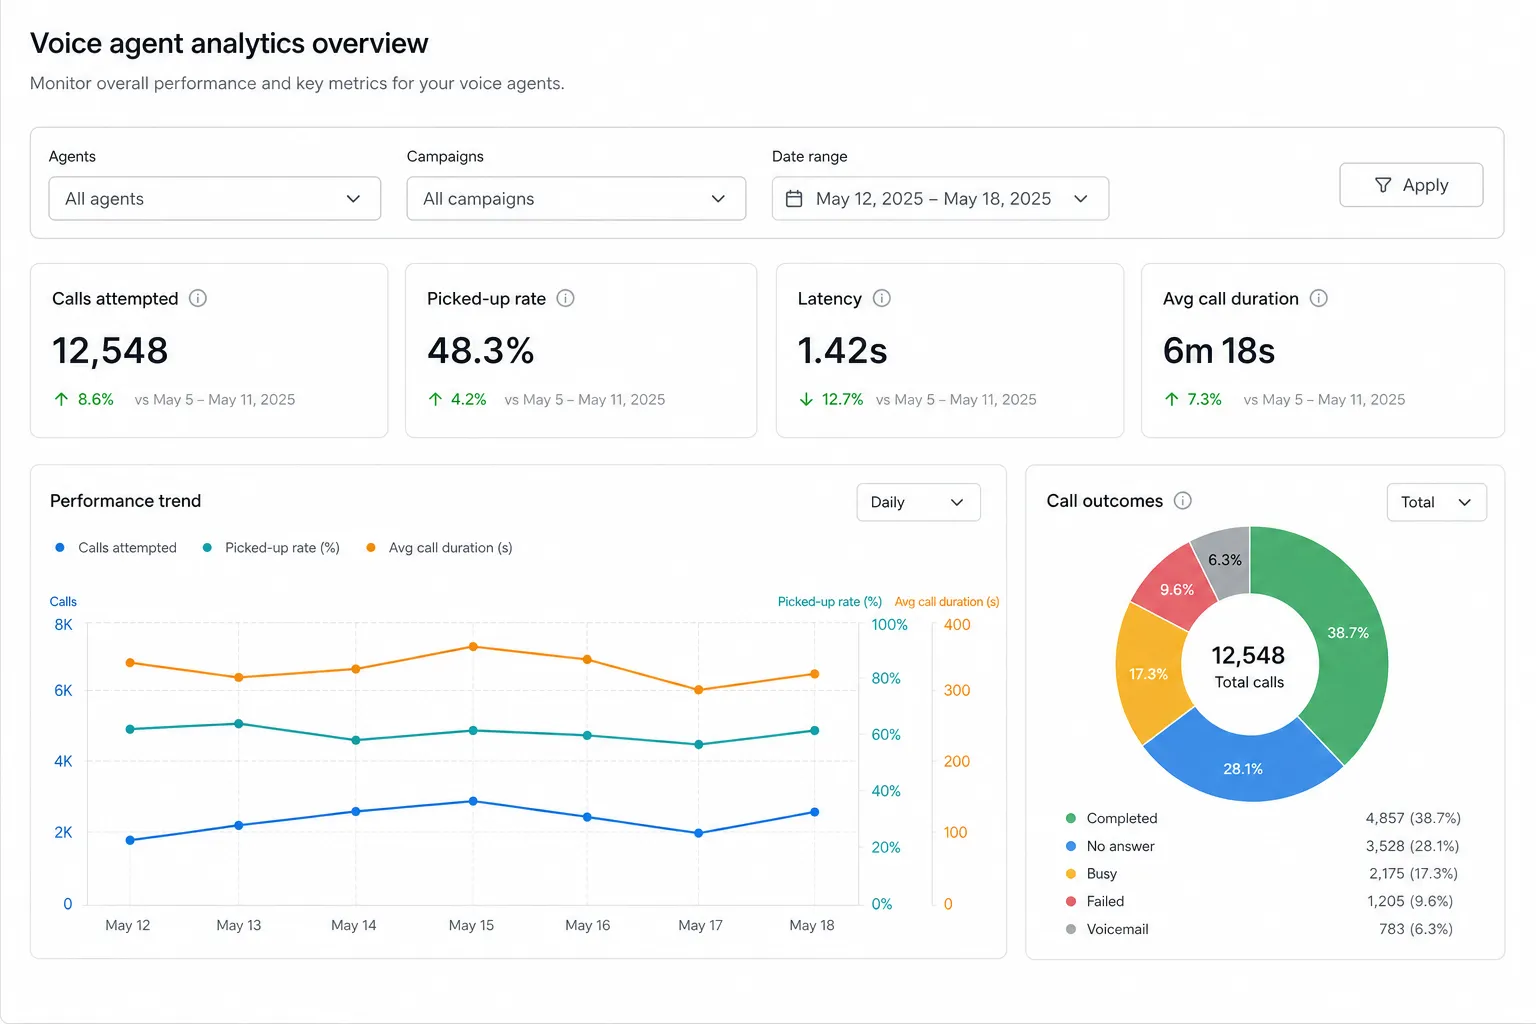
The tabs
Agent Analytics is organized into tabs, each answering a different question about performance.
For turn-level debugging, open a call from Call Logs and use Log Analyser.
Set your scope
The toolbar at the top sets the scope for every tab. Configure it once before reading the charts, as the settings apply across all of Agent Analytics.
How to investigate
A typical investigation starts broad and narrows based on what the data shows. You do not need to open every tab for a routine check.
Start on Overview
Review attempts, picked-up rate, and short calls. If these look healthy, a routine check is complete.
Follow the failure mode
- Connects look weak → Connectivity
- Connects look fine, but conversations are short → Engagement
- The aggregate looks fine, but one campaign, number, or language is off → Group by
Sample real calls
Open Call Logs with the same agents, campaigns, and dates, then review a few examples before changing the agent.
Debug the turn
From Call Log Details, select the message that failed and open Log Analyser to inspect ASR, tools, and variables.